Using similar criteria to Wall Street legend William O'Shaugnessy's Cornerstone Growth Fund I look for undervalued stocks in strong industry groups showing long-term relative strength. Check them out:
CALM - Uptrend with momentum, 10.5% dividend yield
AKS - Support bounce off a 30-day moving average
KOP - Pennant flag break out, 1.86% dividend yield
CQB - Support bounce off a 30-day moving average
FLR - Support bounce off a 30-day moving average beware of $170 as resistance but allow room for a break
ACU - Retesting an ascending triangle
BG - Support bounce
WMT - Pulling back look for a bounce or bull flag, 1.64% dividend yield
NM - Broke resistance w/ volume, 3% dividend yield
GSI - Awesome fundamental stock, Bull flag for a target of $13.50 in the short-term but don't be afraid to let it run
MEA - Forming a bull flag as it is retesting a major resistance break from last month
MAN - Last 6-months has been consolidating and reversing now making a higher low
Showing posts with label Relative Strength. Show all posts
Showing posts with label Relative Strength. Show all posts
Tuesday, May 6, 2008

Friday, April 18, 2008
Consulting: If you can't be part of the solution, there is good money in prolonging the problem.
The business services industry group has been performing well because of the economy. Many of these companies specialize in helping companies become more efficient and profitable. A bad economy is good news for many of these firms as they will be called upon for consulting insights and help. Others simply serve businesses in the day-to-day functions and were outperforming the markets in 2001 and 2002. All of them are uptrending or within a basing pattern.
ADP - Automatic Data Processing
ERES - Eresearch Tech
FCN - FTI Consulting
GPN - Global Payments
HEW - Hewitt Associates Inc
HIL - Hill International
IBM - International Business Machines
IT - Gartner Inc.
MA - Mastercard
MAN - Manpower
MCHX - Marchex Inc
NCI - Navigant Consulting
PAYX - Paychex Inc
PRAA - Portfolio Recovery Accociates
VVI - Viad Corp
WW - Watson Wyatt Worldwide
WXS - Wright Express Corp
ADP - Automatic Data Processing
ERES - Eresearch Tech
FCN - FTI Consulting
GPN - Global Payments
HEW - Hewitt Associates Inc
HIL - Hill International
IBM - International Business Machines
IT - Gartner Inc.
MA - Mastercard
MAN - Manpower
MCHX - Marchex Inc
NCI - Navigant Consulting
PAYX - Paychex Inc
PRAA - Portfolio Recovery Accociates
VVI - Viad Corp
WW - Watson Wyatt Worldwide
WXS - Wright Express Corp
Thursday, March 20, 2008
Nuts and Bolts of It

Look at the Inverse Head & Shoulders pattern on Fastenal Co. (FAST). According to the pattern it should move up to $55 in the next 5 months. Terrific volume confirmation with the MACD lows moving higher gives great confidence in this trade.
Wednesday, February 27, 2008
My Euro Trade
Like most Ferengi's, their passion usually revolves around 2 things: Latinum and oo-mox. Since we don't trade latinum here on earth yet, and we call OO-MOX something else, my passions are not so dissimilar. As you know (all 1 reader out there) that I am passionate about currency trading.
Here is a trade that I recently did on the EUR/USD. I actually told several people to play the bounce off of a strong diagonal support level. There has been a strong resistance level at 1.4900 since November. The Euro has tested this level three times and also creating higher bottoms three times. On the last support level bottom that it created on 2/07/08, was a great entry play to the resistance level again. A move from 1.4500 to the resistance was the play to make. Who doesn't want to make 400 pips? I set my target at 1.4950 and got out yesterday with a 450 pip profit. Not bad for a very good predictive play.

Now the pair has broken this strong resistance level and is continuing up another 200 pips to a very overbought area. I expect a pull back now to the new support of 1.4900 and then a bounce back up to 1.51 to even higher levels. I really can see a move to 1.60 now a higher possibility over the next year. I guess a wait and see on that one. But an new entry at a bounce of 1.490 may be a good bounce.
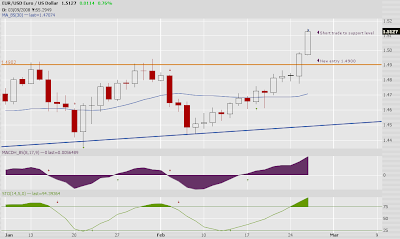
New trades on the EUR/USD - one short reversal trade
For a short trade from these highs to 1.4900 may be a good quick short term play because of overbought area on the position. It may be good but be careful and have fun if you do. Watch your risk and don't over leverage.
We may see some wild things happening but I am in a short trade already to the support area. We will see how it goes.
Here is a trade that I recently did on the EUR/USD. I actually told several people to play the bounce off of a strong diagonal support level. There has been a strong resistance level at 1.4900 since November. The Euro has tested this level three times and also creating higher bottoms three times. On the last support level bottom that it created on 2/07/08, was a great entry play to the resistance level again. A move from 1.4500 to the resistance was the play to make. Who doesn't want to make 400 pips? I set my target at 1.4950 and got out yesterday with a 450 pip profit. Not bad for a very good predictive play.

Recent trade on the EUR/USD
Now the pair has broken this strong resistance level and is continuing up another 200 pips to a very overbought area. I expect a pull back now to the new support of 1.4900 and then a bounce back up to 1.51 to even higher levels. I really can see a move to 1.60 now a higher possibility over the next year. I guess a wait and see on that one. But an new entry at a bounce of 1.490 may be a good bounce.

New trades on the EUR/USD - one short reversal trade
For a short trade from these highs to 1.4900 may be a good quick short term play because of overbought area on the position. It may be good but be careful and have fun if you do. Watch your risk and don't over leverage.
We may see some wild things happening but I am in a short trade already to the support area. We will see how it goes.
Friday, December 7, 2007
Using your Lobes on Job Numbers
Today market participants and conservative politicos were excited about what they saw as a positive job reports. Wiser commentators downplayed the significance of the report and here is why. The job report doesn't account for illegal migrant workers. Construction jobs are taking the brunt of the bearish housing market which has been perhaps the largest employer of illegal workers. Housing start are so slow now that contractors no longer need to take on the risk of hiring these workers. Therefore, these workers don't go in and apply for unemployment for obvious reasons. So in a reporting sense they don't count.
The unemployment records have been screwed for sometime. First of all we haven't been accounting for the the number of illeagal workers in the past. This means those already low unemployment numbers not only had us at full-employment but over-employment. This was a very inflationary sign through all of last year. Wages on "lower tier" jobs were pressed higher because we were "growing" at a fast pace (Or at least we thought we were and kept building on those inflated expectations.) We Ferengi agree with business owners that paying higher wages is hard on the bottom line.
Sales people who were working in the housing and mortgage fields are also left somewhat an accounted. They may very well be looking for work or they may be dying on the vine. Commission based salesman may hold out for some time because of the nature of the sale business. You cannot be in sales and have a defeatist attitude so many salesman will stay at much longer then they can afford. In the end many people should be looking for some type of back up plan and that takes training.
The point that I am making here is to assess the Economic numbers with a grain of salt. I have only pointed out a few weaknesses in the numbers right now. Perhaps the biggest discretion in the numbers is after a person has been unemployed for so long we just quit counting them. If we had counted unemployment like that in the 1930s then the Great Depression would've been the Fairly Big Recession. In the end many people should be looking for some type of back up plan and that takes training.

The market will once again give us the truth of what is going on. We find this by using our relative strength tool. This time we will examine the Education stocks. These are stocks like Apollo Colleges (APOL) whose subsidiary University of Phoenix you are probably most familiar with. Also ITT Technical Institutions (ESI), Corinthian Colleges (COCO), and finally Career Education (CECO) to name a few that lead the markets back in 2001-2003. We can see in our graph here that money has been flowing into this industry group for about a year. This tells me that the "Smart Money" believes that unemployment and/or underemployment (having a job that doesn't cover your needs) are a much bigger concern then what the economic numbers are telling us.
The unemployment records have been screwed for sometime. First of all we haven't been accounting for the the number of illeagal workers in the past. This means those already low unemployment numbers not only had us at full-employment but over-employment. This was a very inflationary sign through all of last year. Wages on "lower tier" jobs were pressed higher because we were "growing" at a fast pace (Or at least we thought we were and kept building on those inflated expectations.) We Ferengi agree with business owners that paying higher wages is hard on the bottom line.
Sales people who were working in the housing and mortgage fields are also left somewhat an accounted. They may very well be looking for work or they may be dying on the vine. Commission based salesman may hold out for some time because of the nature of the sale business. You cannot be in sales and have a defeatist attitude so many salesman will stay at much longer then they can afford. In the end many people should be looking for some type of back up plan and that takes training.
The point that I am making here is to assess the Economic numbers with a grain of salt. I have only pointed out a few weaknesses in the numbers right now. Perhaps the biggest discretion in the numbers is after a person has been unemployed for so long we just quit counting them. If we had counted unemployment like that in the 1930s then the Great Depression would've been the Fairly Big Recession. In the end many people should be looking for some type of back up plan and that takes training.

The market will once again give us the truth of what is going on. We find this by using our relative strength tool. This time we will examine the Education stocks. These are stocks like Apollo Colleges (APOL) whose subsidiary University of Phoenix you are probably most familiar with. Also ITT Technical Institutions (ESI), Corinthian Colleges (COCO), and finally Career Education (CECO) to name a few that lead the markets back in 2001-2003. We can see in our graph here that money has been flowing into this industry group for about a year. This tells me that the "Smart Money" believes that unemployment and/or underemployment (having a job that doesn't cover your needs) are a much bigger concern then what the economic numbers are telling us.
Monday, December 3, 2007
Insurance Surveillance
Chances are this week aren't going to see much action in the markets as far as buying and selling. We Ferengi always keep an eye on the lunar cycle and the lunar cycle is moving into its consolidation phase, but that is a topic for a different time. I my post Finding Stocks the Ferengi Way I highlighted Insurance (Accident & Health) so I will highlight a few stocks in which I the Bajoran Profit am keeping my lobes alert for.
Long term chart of UNH

In the 2 year weekly chart of UNH we see the downward trend has been broken although we are definitely cautious since see another resistance level at 56. Our oscillators at the bottom both gave us bullish divergences as a an alert to the recent movement and the trend reversal. With the new found uptrend in the industry group we are bullish on this stock's ability to break resistance. This is probably not the entry for a swing trader but the trend trader should consider a small position here.
Short term chart of UNH

The next stock in this group is WLP or Wellpoint Inc. The long-term chart of WLP shows a downward consolidation that was recently broken. The trend trade could entry here with a stop around $82 and then scale into a larger position if and when the stock breaks the $86 resistance level.
Long term chart of WLP

The shorter term play would be the channel itself. No doubt the break a few weeks ago would've been the best entry but we are half way through the $10 move now. Entering now with a stop at the quarter mark ($82.50) can still allow us to make a little off them move here and keep at least a 2 to 1 reward to risk ratio.
Short term chart of WLP

Long term chart of UNH

In the 2 year weekly chart of UNH we see the downward trend has been broken although we are definitely cautious since see another resistance level at 56. Our oscillators at the bottom both gave us bullish divergences as a an alert to the recent movement and the trend reversal. With the new found uptrend in the industry group we are bullish on this stock's ability to break resistance. This is probably not the entry for a swing trader but the trend trader should consider a small position here.
Short term chart of UNH

The next stock in this group is WLP or Wellpoint Inc. The long-term chart of WLP shows a downward consolidation that was recently broken. The trend trade could entry here with a stop around $82 and then scale into a larger position if and when the stock breaks the $86 resistance level.
Long term chart of WLP

The shorter term play would be the channel itself. No doubt the break a few weeks ago would've been the best entry but we are half way through the $10 move now. Entering now with a stop at the quarter mark ($82.50) can still allow us to make a little off them move here and keep at least a 2 to 1 reward to risk ratio.
Short term chart of WLP

Tuesday, November 27, 2007
Finding Stocks The Ferengi Way
Here are a few key Ferengi Rules of Acquisition that can helps us find stocks in which we would want to trade. These rules are significant because they lead us into a top down approach. A wise man can hear profit in the wind because he is looking for the next opportunity. He understands that in a bull market everyone looks like a trading guru but a bear weeds out the chaff. The crowd jumps on at the end when the wise and prudent are selling and those who have become educated will reap the rewards.
Rule 22 – A wise man can hear profit in the wind
Rule 44 – Never confuse wisdom with luck
Rule 69 – Ferengi are not responsible for the stupidity of other races
Rule 74 – Knowledge equals profit
Rule 162 – Even in the worst of times someone turns a profit
Rule 217 – You can’t free a fish from water
Below you will find relative strength charts of four different industry groups versus the S&P 500. If the chart is uptrending then the industry group is outperforming the S&P 500 whereas the opposite is true if we were searching for bearish stocks. The recent decline in the markets makes the wise trader prove his mettle. As I mentioned before the prudent investor is looking for the next opportunity. Since stocks tend to move with their industry groups we can find good stocks by finding industry groups with strength.
Relative Strength Charts
Major Drugs


Tobacco has been showing strength for some time so we aren’t necessarily finding a bottom but we are seeing a break out of a “resting period”. These companies do a lot of exporting so they are benefiting from a weak American dollar. Also, any Ferengi investor understands what a good investment addictive products are!
Oil & Gas Operations
We have all seen gas and oil companies profiting from the rise in oil prices. Once again the weak dollar along with higher world demand for crude has driven oil prices higher and higher. A break out of this consolidation is also evident on the chart.
Here we have identified four possible groups of opportunity. Look for my next postings where I will identify stocks and ETF stocks that will allow us to begin out profiteering.
On a side note, these are all industry groups that perform well when the economy is about to go into recession.
Rule 22 – A wise man can hear profit in the wind
Rule 44 – Never confuse wisdom with luck
Rule 69 – Ferengi are not responsible for the stupidity of other races
Rule 74 – Knowledge equals profit
Rule 162 – Even in the worst of times someone turns a profit
Rule 217 – You can’t free a fish from water
Below you will find relative strength charts of four different industry groups versus the S&P 500. If the chart is uptrending then the industry group is outperforming the S&P 500 whereas the opposite is true if we were searching for bearish stocks. The recent decline in the markets makes the wise trader prove his mettle. As I mentioned before the prudent investor is looking for the next opportunity. Since stocks tend to move with their industry groups we can find good stocks by finding industry groups with strength.
Relative Strength Charts
Major Drugs

I particularly like this chart because it has recently broken out of a down trend. Although we didn’t get the very bottom (and rarely will we ever) we may be getting in on a fresh new uptrend.
Insurance Accident & Health
Insurance Accident & Health

Insurance gives me similar excitement because we see it was in a sideways basing pattern for some time. Now we see it has broken out of its consolidation and a new uptrend may be on the way.
Tobacco
Tobacco

Tobacco has been showing strength for some time so we aren’t necessarily finding a bottom but we are seeing a break out of a “resting period”. These companies do a lot of exporting so they are benefiting from a weak American dollar. Also, any Ferengi investor understands what a good investment addictive products are!
Oil & Gas Operations

We have all seen gas and oil companies profiting from the rise in oil prices. Once again the weak dollar along with higher world demand for crude has driven oil prices higher and higher. A break out of this consolidation is also evident on the chart.
Here we have identified four possible groups of opportunity. Look for my next postings where I will identify stocks and ETF stocks that will allow us to begin out profiteering.
On a side note, these are all industry groups that perform well when the economy is about to go into recession.
Subscribe to:
Posts (Atom)


